This Matlab tutorial shows you how to use ActiveX in Matlab. This tutorial also applies to DI-145, DI-149 and DI-155.
In this lesson, we will use Ultimaserial ActiveX to demonstrate how to develop a data acquisition application with DATAQ's Starter kit. Here, you will find examples on how to
-
Load an ActiveX control, e.g. actxcontrol('ULTIMASERIAL....)
-
Access a simple property, e.g. set(ultimaserial1, 'ChannelCount', 4)
-
Access a property with parameter, e.g. set(ultimaserial1, 'PChannel',0,0)
-
Invoke a parameter-less method, e.g. Ultimaserial.Start
-
Invoke a method with parameters, e.g. xchart1.SetTextPos(100,100)
-
Investigate an ActiveX's methods, e.g. methodsview(ultimaserial1)
-
Show an ActiveX's properties, e.g. get(ultimaserial1)
-
Handling ActiveX events, e.g. ultimaserial1.registerevent({'NewData','newdata'})
-
How to specify path for associated files, e.g. addpath ('c:\matlab')
Instructions:
-
Download the Matlab Example files, which includes ultimaserial.m and newdata.m. Unzip them to c:\matlab so that you can use it as reference as you read on.
-
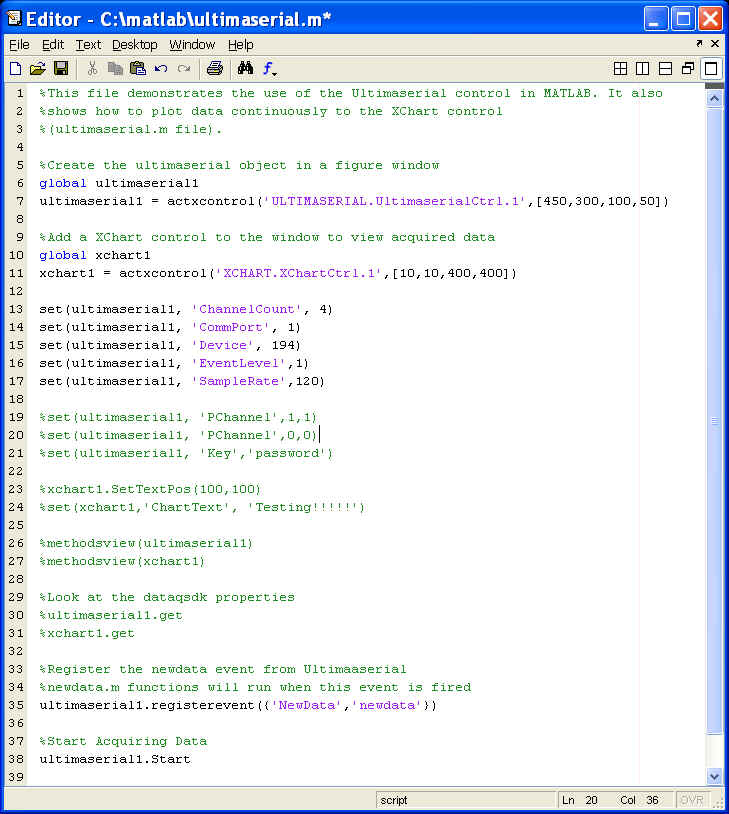
Use Matlab Editor or Notepad to open Ultimaserial.m. DI-194 is the default device here. If you use other devices, you will need to modify the script accordingly. For example,. if you use DI-148U, please change set(ultimaserial1, 'Device', 194) to set(ultimaserial1, 'Device', 148) and set(ultimaserial1, 'CommPort', 1) to set(ultimaserial1, 'CommPort', 0)
-
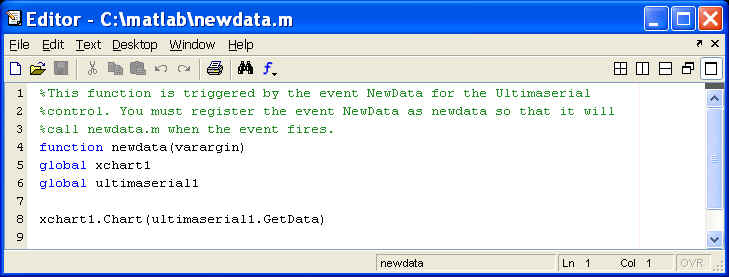
Use Matlab Editor to open newdata.m, and you will see the following codes.
-
Connect DI-194 to the COM 1 of your PC
-
Start Matlab
-
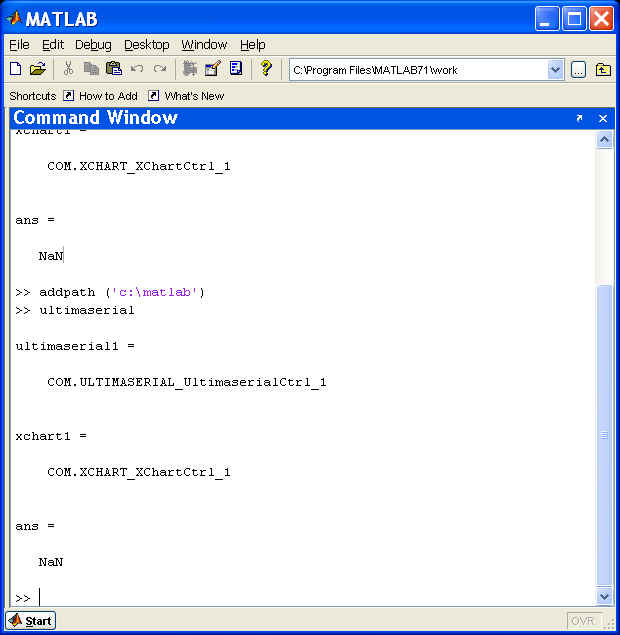
In Matlab's command window, type in addpath ('c:\matlab') so that it knows where to pick up the associated files
-
Next, in the same command window, type in ultimaserial to start running the script (m file)
-
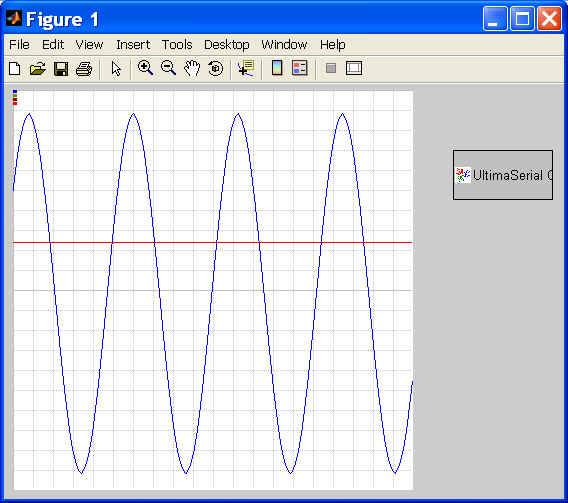
You will see Ultimaserial running in MATLAB's Figure 1 Window
-
Here are a few tips to help you better understand the script
-
To load Ultimaserial ActiveX into Matlab and assign it to a handle called Ultimaserial1: Ultimaserial1=actxcontrol ('ULTIMASERIAL.UltiamaserialCtrol.1')
-
If you'd like to show all the property of Ultimaserial, you may use get(Ultimaserial1)
-
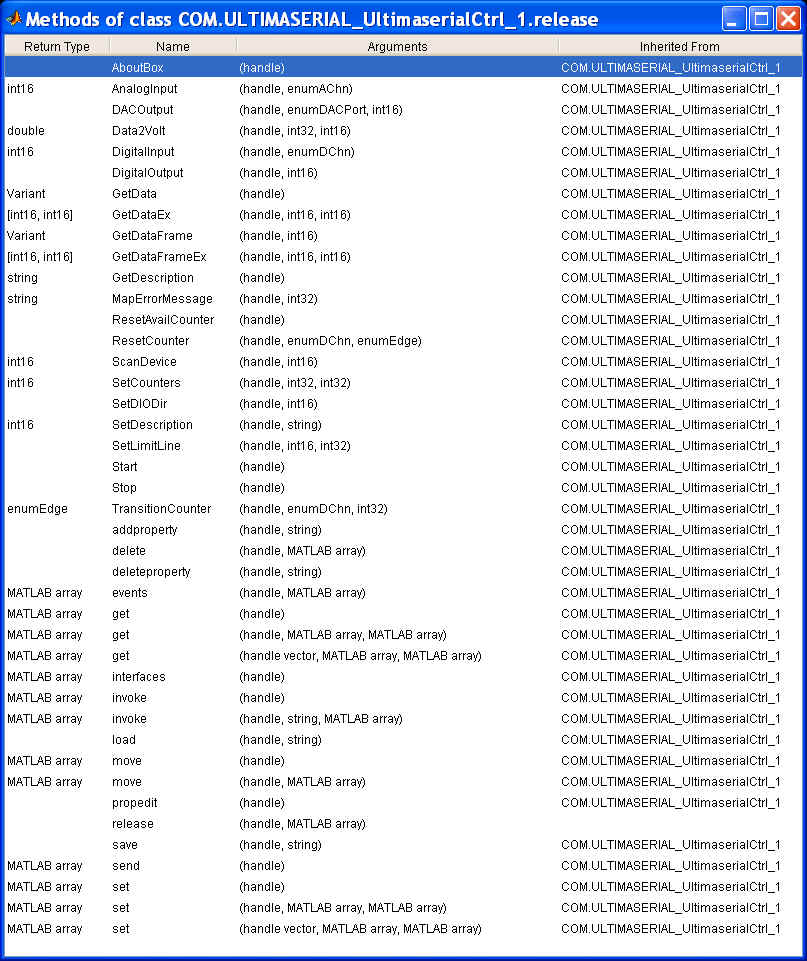
To see all registered events and methods, use methodsview(Ultimaserial1)
-
Make the handle Ultimaserial1 global so that it can be accessed from multiple m files, use global ultimaserial1
-
To assign a value to the property Device of Ultimaserial1, use set(ultimaserial1, 'Device', 148)
-
You may verify the assignment using get(ultimaserial1, 'Device')
-
To add an event handler for the NewData event, use ultimaserial1.registerevent({'NewData','newdata'}). Make sure the matching m.file newdata.m resides in the same folder as ultimaserial.m
-
-
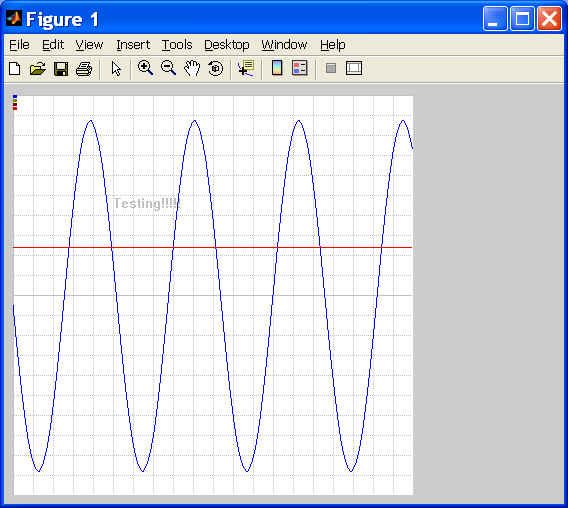
If you uncomment xchart1.SetTextPos(100,100) and set(xchart1,'ChartText', 'Testing!!!!!') by removing the % in front of them, you can add the text of "Testing!!!" to the waveform display:
-
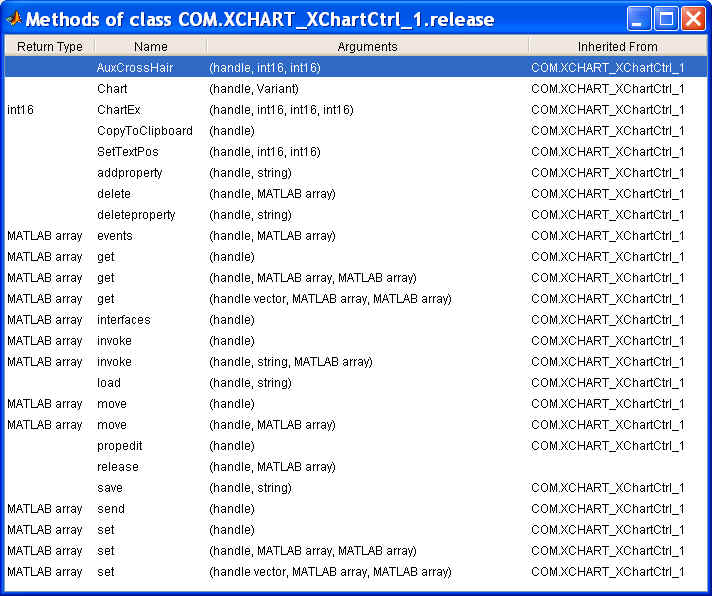
If you uncomment methodsview(ultimaserial1) and methodsview(xchart1) by removing the % in front of them, the Command windows of Matlab will display all methods of Ultimaserial and XChart:
If you uncomment ultimaserial1.get and xchart1.get by removing the % in front of them, you will see the following display on the command window of Matlab
ultimaserial1 =
COM.ULTIMASERIAL_UltimaserialCtrl_1
xchart1 =
COM.XCHART_XChartCtrl_1
Device: 194
CommPort: 1
ChannelCount: 4
Key: ''
SampleRate: 120
EventLevel: 1
AvailableData: 0
SerialNumber: ''
PreTriggerLength: 100
PostTriggerLength: 100
AcquisitionMode: 'NoCondition'
MaskOutDigitalBits: 0
TriggerChannel: 'PCh1'
TriggerStatus: 0
TriggerLevel: 0
SquareWaveOutput: 0
DevQuitLevel: 10
MatchSerialNumber: 0
PChannel: [1x35 char]
PGain: [1x35 char]
ActiveChannel: 0
BaseLineLegend: 0
Channel: -1
ChannelMask: -1
ChartText: ''
DigitalMask: 'Disabled'
GridSpacingX: 20
GridSpacingY: 20
GroupSetting: 1
Lock: 0
PEraseBar: 8388608
PGrid: 12632256
PText: 12632256
ScrollMode: 1
ShowEraseBar: 1
ShowLegend: 1
SolidBaseLine: 1
Step: 1
Xmax: 400
SumWaveforms: 0
DoubleActiveTrace: 0
Persist: 0
Key: [1x150 char]
PLine: [1x35 char]
Ymax: [1x35 char]
Ymin: [1x35 char]
BaseLine: [1x35 char]
-
You may also want to try out the following immediate commands under the Command Window of Matlab. Please do not copy and paste the following text into Matlab's command window directly since web text may contain extra hidden characters Matlab does not understand. Type in the command yourself
-
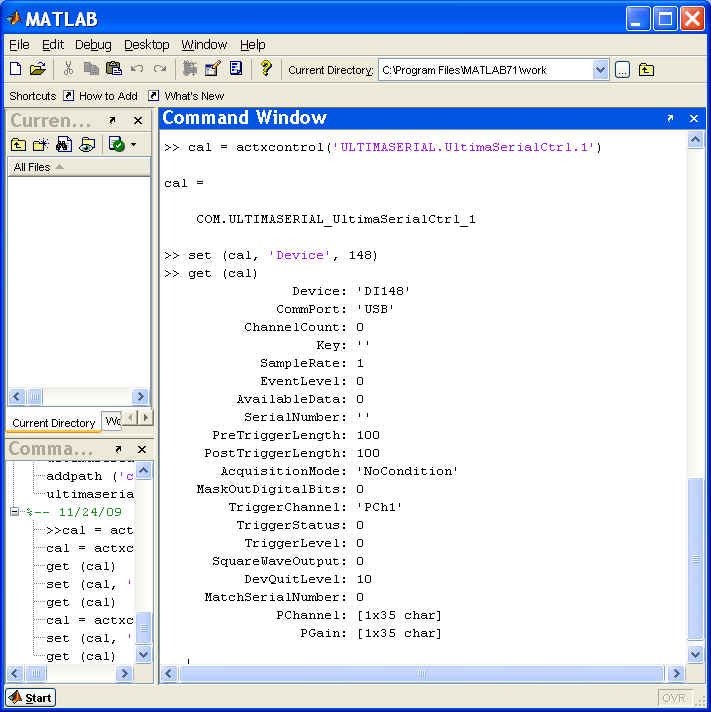
cal = actxcontrol ('ULTIMASERIAL.ultimaserialctrl.1')
-
set (cal, 'Device', 148)
-
get (cal)
-
-
You will get this
-
To change the scanlist, type in set (cal, 'PChannel', 0, 2), you can verify the assignment by typing in get (cal, 'PChannel', 0). Again, please do not copy and paste the commands from this page into Matlab's command window directly since web text may contain extra hidden characters Matlab does not understand. Type in the command yourself
-
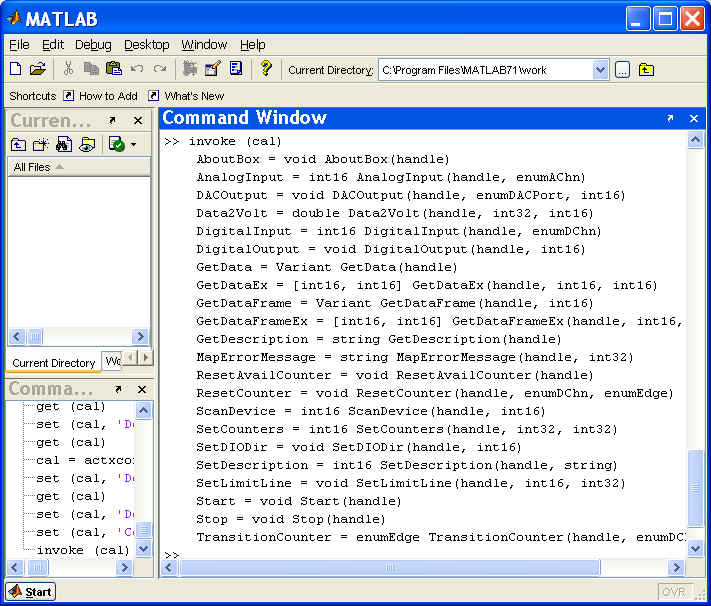
Type in invoke (cal), and you will get this:
-
Try these commands. Please do not copy and paste the following text into Matlab's command window directly since web text may contain extra hidden characters Matlab does not understand. Type in the command yourself
-
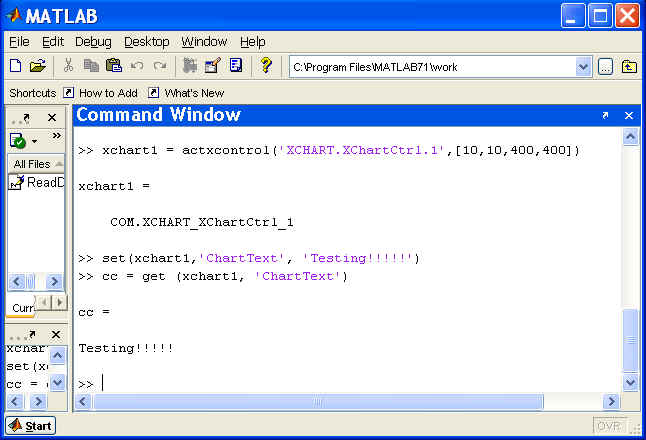
xchart1 = actxcontrol('XCHART.XChartCtrl.1',[10,10,400,400])
-
set(xchart1,'ChartText', 'Testing!!!!!')
-
cc = get (xchart1, 'ChartText')
-
-
You will get this
Last update: 03/14/22
Copyright: 2000-2005 www.UltimaSerial.com