UltimaSound is a real-time audio signal analysis software
With UltimaSound spectrogram software and a laptop, you can see a vivid picture of your voice and music in frequency domain in real time!
Here is an youtube teaser for the software:
This is a great project for science fair and science class teaching in middle/high school to visually demonstrate the elements of sound: frequency, amplitude, pattern, spectrum. Read on and you will know how to impress your friends and teachers in science fair.
What should you know first?
It is time to review what you learnt in science class. Well, if you have returned what you learnt to the teachers after passing the grade, you may find the following wiki info useful :)
UltimaSound is a Freeware for home use.
To use UltimaSound
-
Set up the configuration like the demo below, or you may opt to use an audio cable to connect the line-out port to the line-in port on your PC for a better capturing quality:
-
Download any of the sample sound files below and use a Media Player or Window's Sound Recorder, which can be found in Windows-> Start->All Programs-> Accessories-> Entertainment group if you use Windows XP, to playback it back while using UltimaSound to capture the spectrogram..
-
Sound file contains the word "Hello", which is demonstrated in the video above.
-
-
Download Coagula Light to create or import any image and play it back, from your PC's speaker to microphone, and you will capture the image like a fax machine, please refer to the teaser youtube video in the beginning of the page.
-
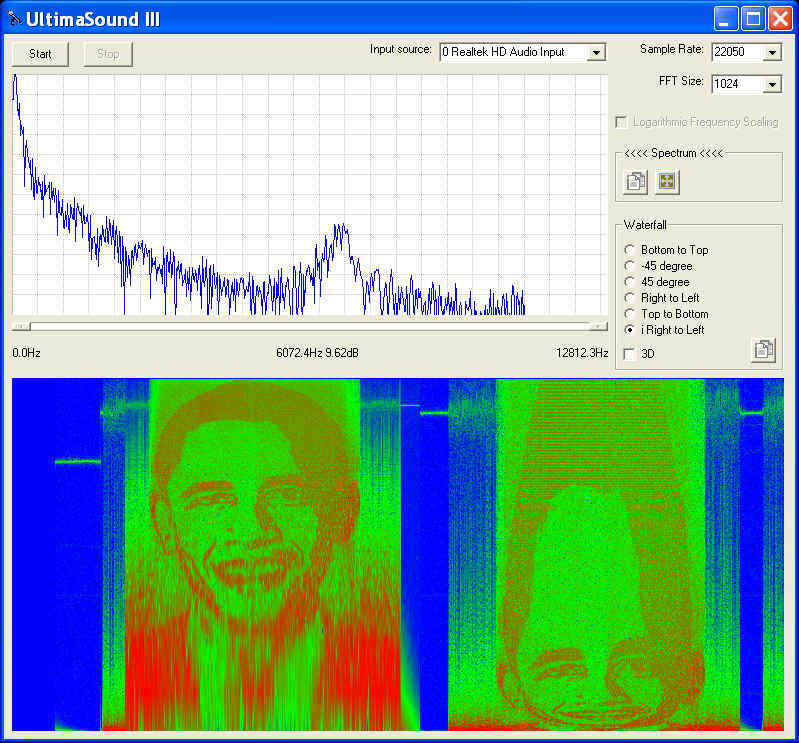
Note: Coagula converts image to sound file with Logarithmic Frequency Scaling, thus you will notice distortion in frequency direction unless you check the appropriate option in UltimaSound (see the screen capture below, the left image is produced when Logarithmic Frequency Scaling was on, the right is when Logarithmic Frequency Scaling was off)
-
Sample BMP file that produces the sound image in the Youtube teaser video.

- Sample audio file that produces the sound image above
- Based on your PC's performance, you may need to adjust the height and width of UltimaSound panel to achieve the best proportion for the image.
- More Coagula Light demo videos
-

-
Some Science Fair Project Ideas :
- Compare the fidelity between different cell phone carriers and land line
phones
- Hint, you may want to enable the persist feature of UltimaSound and a sweeping sound source to go through the whole frequency range
- Playback a song and watch its spectrogram
- Play your piano, guitar, violin or other musical instruments, and capture the notes
- Reference: Piano Key frequencies
- Talk or whistle to the microphone directly
- Reference: Audio Frequency
- Identify animal sounds
- Reference: Farm Animal Sounds
- Evaluate the sound quality of different headphones/speakers and
microphones
- Hint, you may want to use the persist feature of UltimaSound and a sweeping sound source to go through the whole frequency range
- Compare the fidelity between different cell phone carriers and land line
phones
-
UltimaSound has been upgraded with a better GUI and more powerful FFT engine
-
Up to 16 times higher frequency resolution (16384-point FFT), this is especially helpful when you enable the maximum sample rate for your sound system
-
Up to 16 times higher sensitivity (16-bit ADC readings), thus it will pick up a lot more audio activities.
-
Faster and smoother charting
-
Three scaling options for the frequency axis:
-
Standard Frequency Scaling, each pixel line represents one frequency component and you may use the horizontal scroll bar to scroll the interested frequency range into view.
-
Logarithmic Frequency Scaling, to fit the full frequency range to the charting area with a logarithmic scale. This is perfect to display Coagula Light's sound files or generate a frequency response like what you see in an audio engineering chart
-
Full-fit Frequency Scaling, to fit the full frequency range to the charting area with a linear scale
-
-
Six charting directions for waterfall display
-
Bottom to top, it takes the spectrum windows from the chart above as its own, and the waterfall flows up
-
-45 degree, it takes the spectrum windows from the chart above as its own, and the waterfall flows down in a -45 degree slope
-
45 degree, it takes the spectrum windows from the chart above as its own, and the waterfall flows up in a 45 degree slope
-
Right to left, with the lowest frequency on top the chart, and the waterfall flows from right to left
-
Top to bottom, it takes the spectrum windows from the chart above as its own, and the waterfall flows down
-
iRight to left, with the lowest frequency at bottom the chart, and the waterfall flows from right to left
-
-
2D or 3D effect for waterfall display
-
Sizable Charts (see above) and frequency scroll bar to study a certain frequency range
-
Single click on BestFit
 button to
bring a weak signal into sight immediately
button to
bring a weak signal into sight immediately -
Easy drag, mouse wheel roll to change the offset and amplitude of the FFT spectrum window, which will also change the display in the waterfall chart
-
Frequency resolution of UltimaSound is SampleRate/FFTSize
-
Last update: 07/26/24
© www.ultimaserial.com