The following is a step-by-step tutorial on how to use ActiveX in LabView
In this lesson, we will use Ultimaserial ActiveX to develop a data acquisition application with DATAQ's Starter kit, including DI-194, DI-148U, DI-145, DI-14, DI-155, DI-158U and DI-710U. You will learn
-
How to import an ActiveX in LabView
-
Use its properties and methods
-
How to convert the variant returned from the ActiveX to data array
-
How to extract members from the converted data array
-
Output the data array to Labview's Waveform Chart or Ultimaserial's XChart
Instructions:
-
Start Labview. Here we are using LabView 9 so you may notice different icon, text and/or drop-down menu location when comparing to your version of LabView. If your LabView is a much older version, please take a look at the LabView 5 and LabView 6 examples
-
If possible, please open one of the LabView 9 Sample VI as reference. LabView 9 examples include
-
test.vi, created from this lesson, up to step 36
-
test2.vi, based on test.vi, with added Waveform Chart beyond step 36
-
us9.vi, based on test.vi, but uses dial and list box for sample rate and COM port selection
-
-
Follow New->Blank VI to create a new Front Panel
-
Right click on the grid on the Front panel
- When the drop down menu shows up, click on the double down arrow
at the bottom of the menu, select .NET & ActiveX->ActiveX
Container and place one on the grid of the Front panel:
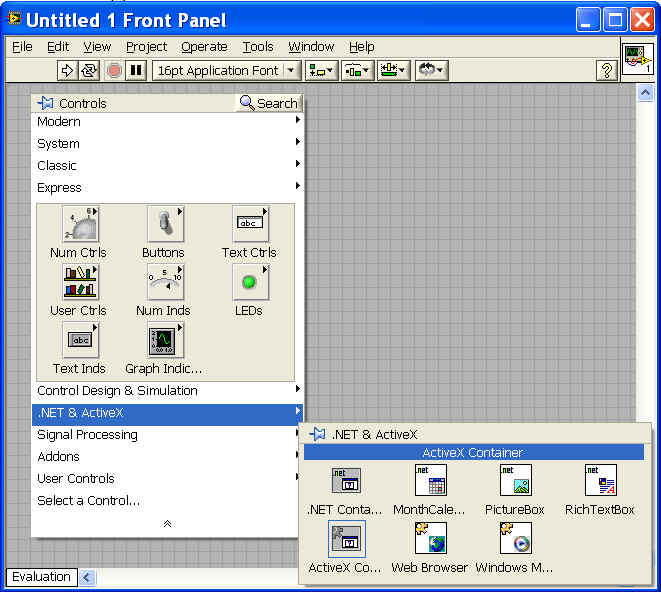
- Right click inside the ActiveX container on Front panel, select Insert ActiveX Object...., then Ultimaserial from the list. If you need to interface to multiple Windaq Starter kits at the same time, you will need to create one ActiveX container with Ultimaserial in it for each device
- Repeat 3) to 5) to insert XChart
- On the panel grid, follow Right-click->Buttons->Text Button to add a
text button
- Right click on the button
- Under the Appearance tab
- Change the On text to Stop, Off text to Start.
- Change Label to Start/Stop
- Uncheck visible flag for the Label.
- Under Operation tab, change Button behavior to "Switch when released"
- On the panel grid, follow Right-click->Num Inds->Num Ind to add a numeric display
- Follow Right-click->Num Inds->Num Ind to add another numeric display
- Follow Right-click->Num Ctrls->Num Ctrl to add a numeric
input.
- Right click on it
- Under Appearance table
- Uncheck "Show Increment/decrement buttons".
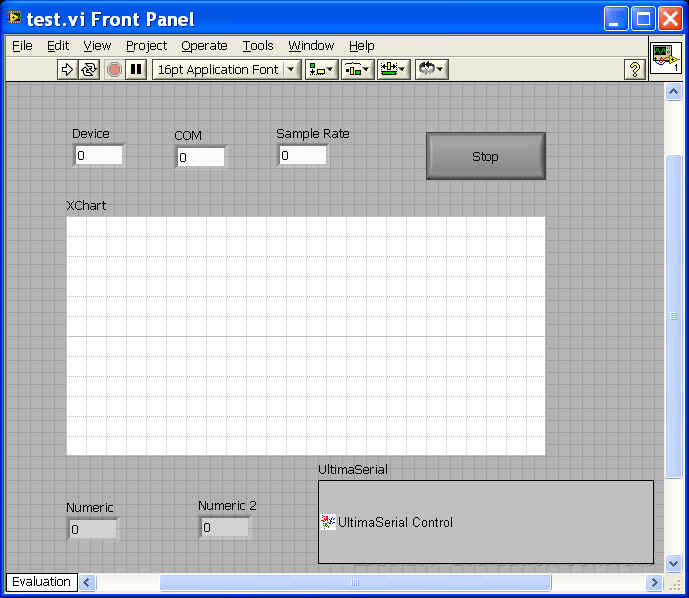
- Change Label text to Device
- Under Appearance table
- Right click on it
- Follow Right-click->Num Ctrls->Num Ctrl to add another numeric
input.
- Right click on it
- Under Appearance table
- Uncheck "Show Increment/decrement buttons".
- Change Label text to "COM"
- Under Appearance table
- Right click on it
- Follow Right-click->Num Ctrls->Num Ctrl to add another numeric
input.
- Right click on it
- Under Appearance table
- Uncheck "Show Increment/decrement buttons"
- Change Label text to "Sample Rate"
- Under Appearance table
- Right click on it
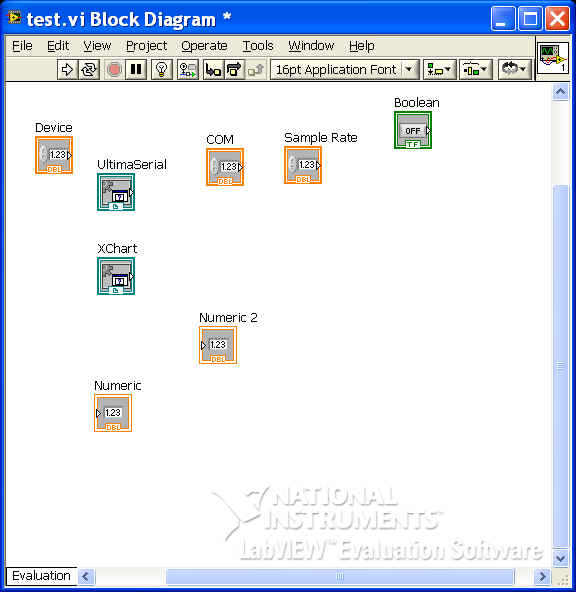
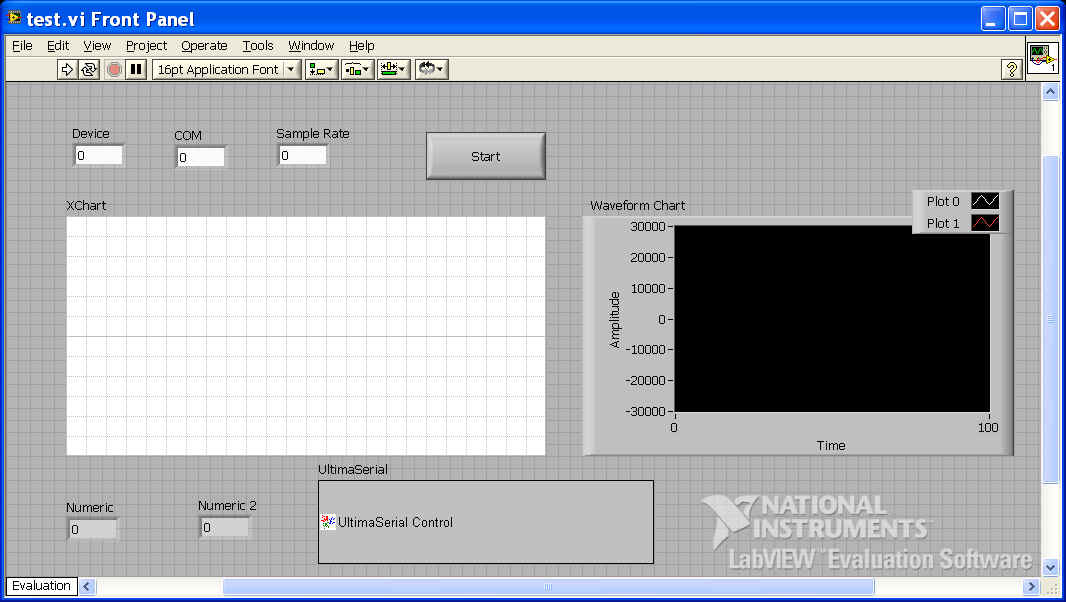
- Save the vi as test.vi. Now the front panel of our vi should look like the following:
- From the menu bar, follow Window->Show Block Diagram to bring up the
test.vi Block Diagram, which is like the following
- Right click on the workspace. When the drop down menu shows up, click on the double down arrow at the bottom of the menu, select Programming->Structures->Stacked Sequences
- Right click on the frame and select "Add Frame after"
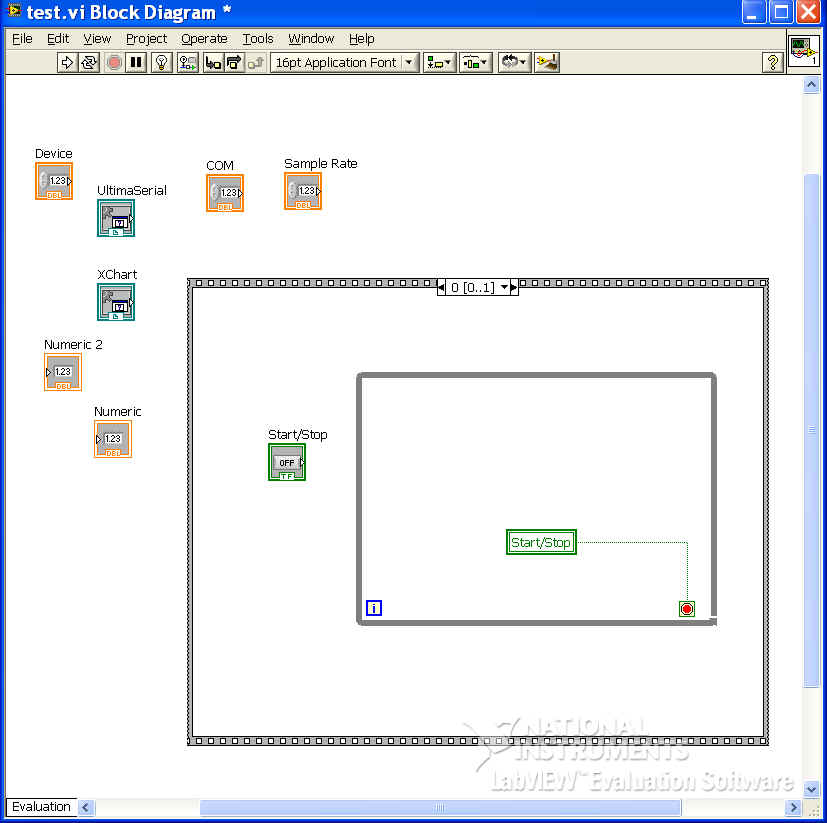
- Inside Frame 0, add "while loop" from RightClick->DoubleDownArrow->Programming->Structure->While Loop
- Create a local variable for Start/Stop button, Change To Read, and connect
it to loop condition
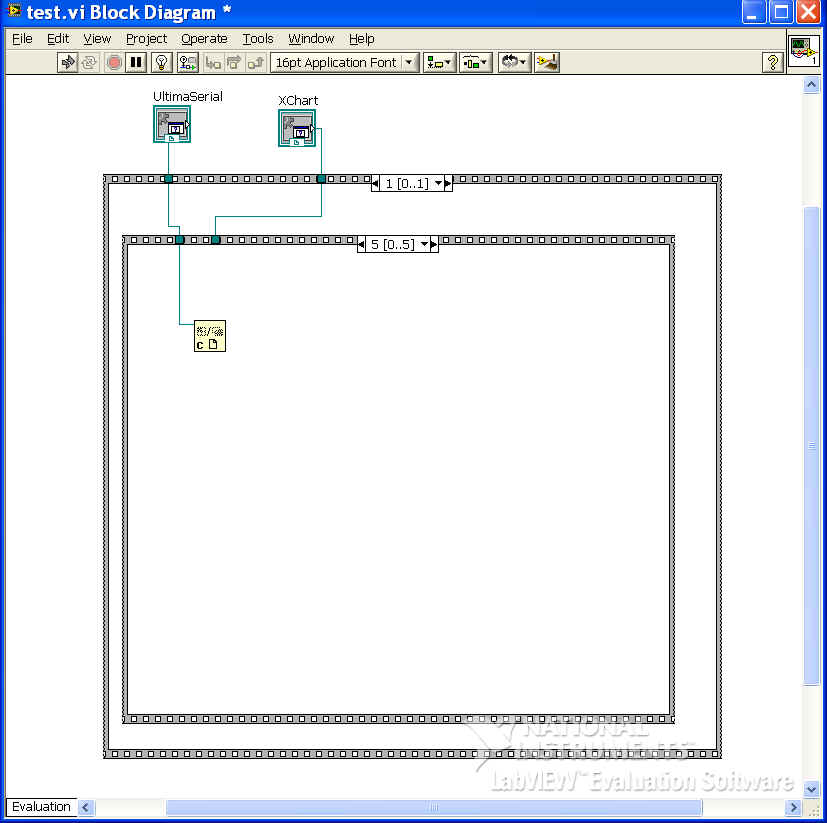
- Insert another stacked sequence to Frame 1 of the above stacked sequence
- Add five frames to the new sequence, now the block diagram is like this
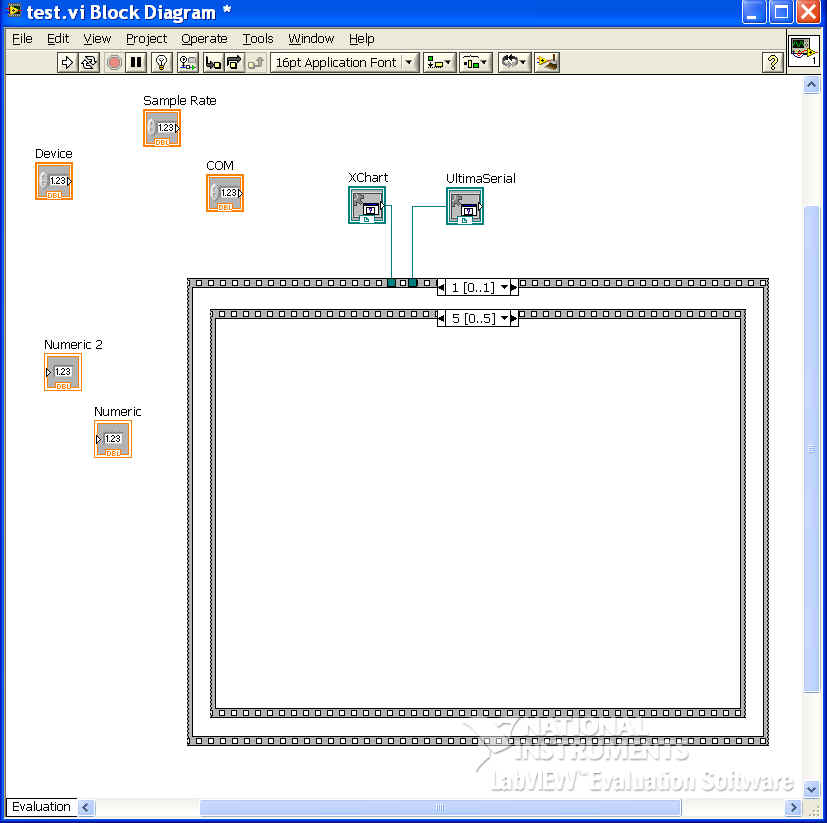
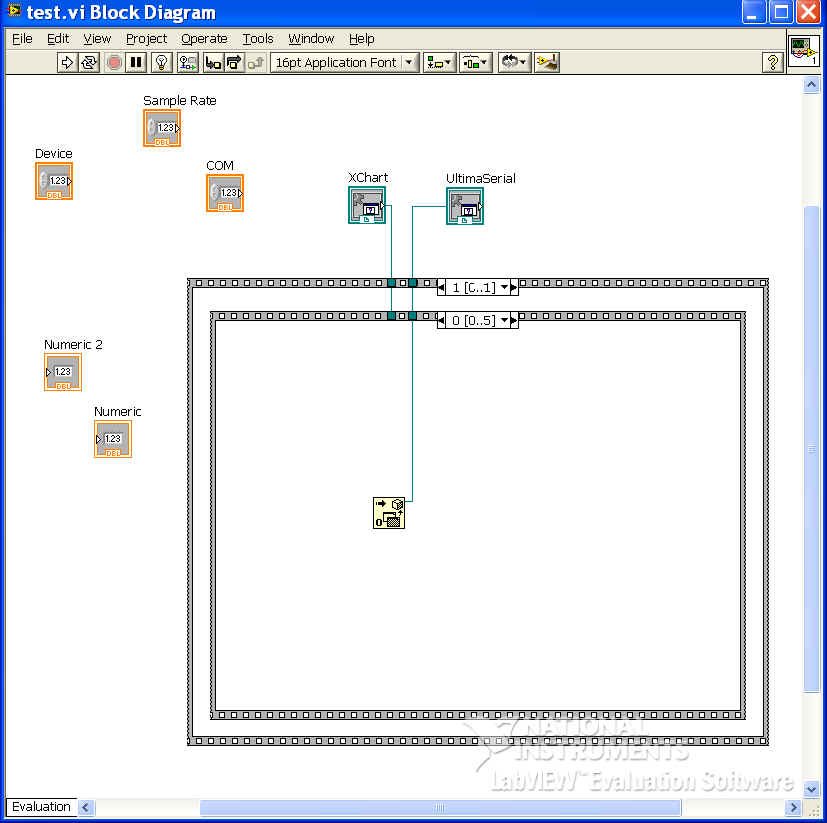
- In Frame 0 of the inner sequence frame, RightClick->DoubleDownArrow->Connectivity->ActiveX->Automation.
Connect the automation line to the icon of Ultimaserial
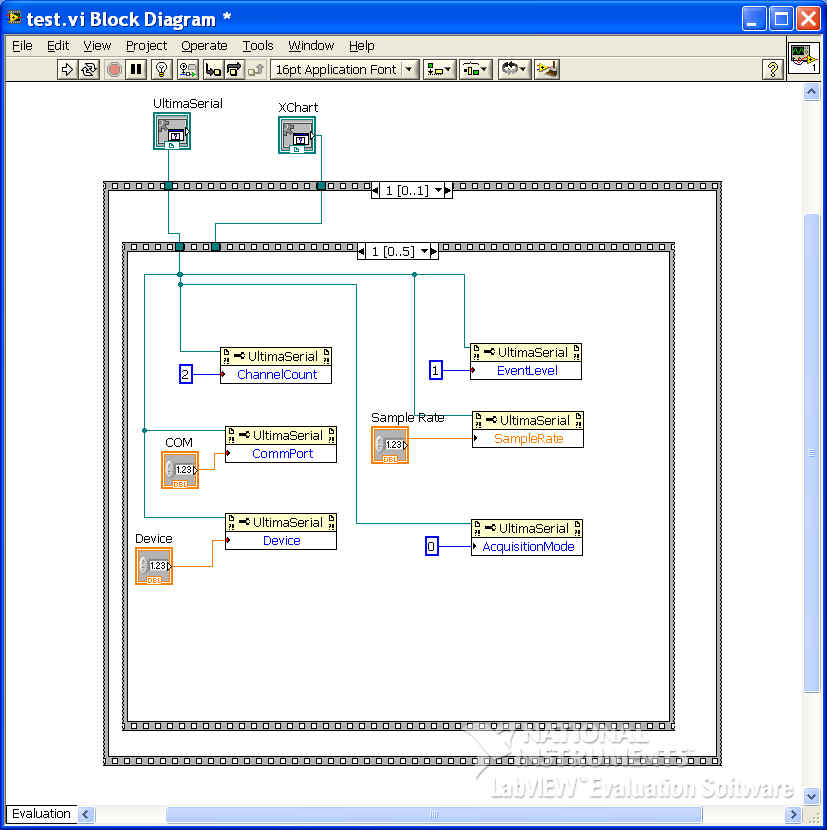
- In Frame 1 of the same sequence, right click on Ultiamserial->Create->Property for ULTIMASERIAL....class to bring in ChannelCount, EventLevel, CommPort, Device, AcquisitionMode and SampleRate
- Change the above properties to Write
- Create three numeric constants 2, 1 and 0: RightClick->DoubleDownArrow->Mathematics->Numeric->Numeric Co.
- Link the appropriate inputs to the above properties. With this
configuration, we enable two channels, no trigger condition, update data at
highest rate.
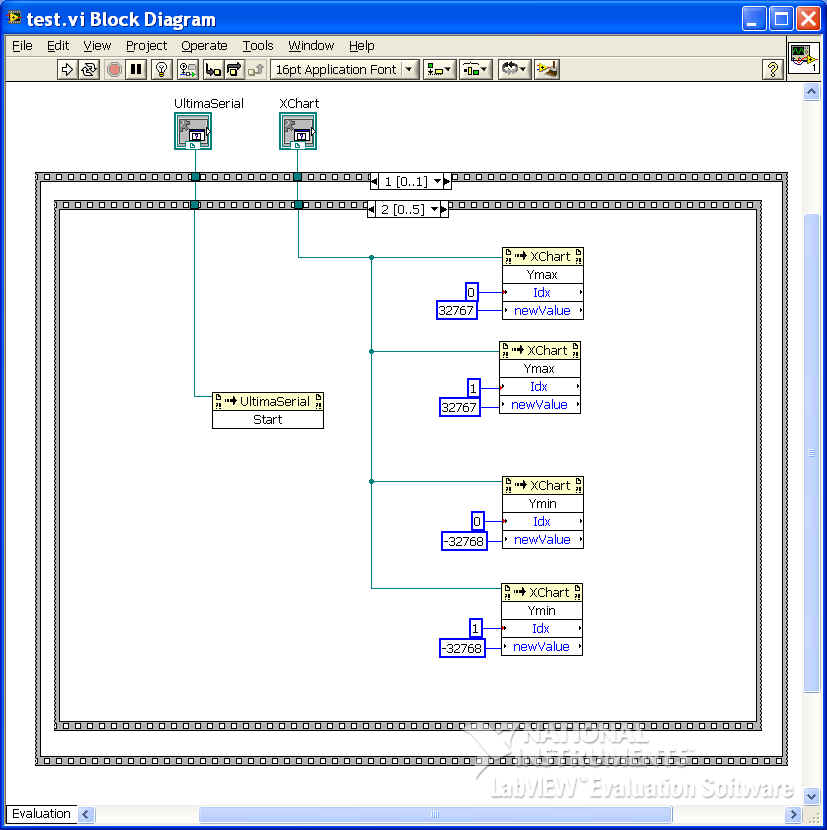
- In Frame 2 of the same sequence, right click on Ultiamserial->Create->Method
for ULTIMASERIAL....class to bring in Start.
To demonstrate how to use XChart, right click on XChart->Create->Method
for XCHART....class to bring in Ymax (put)
and Ymin (put), wire them like this to
initialize them so that it takes the full range of the ADC readings
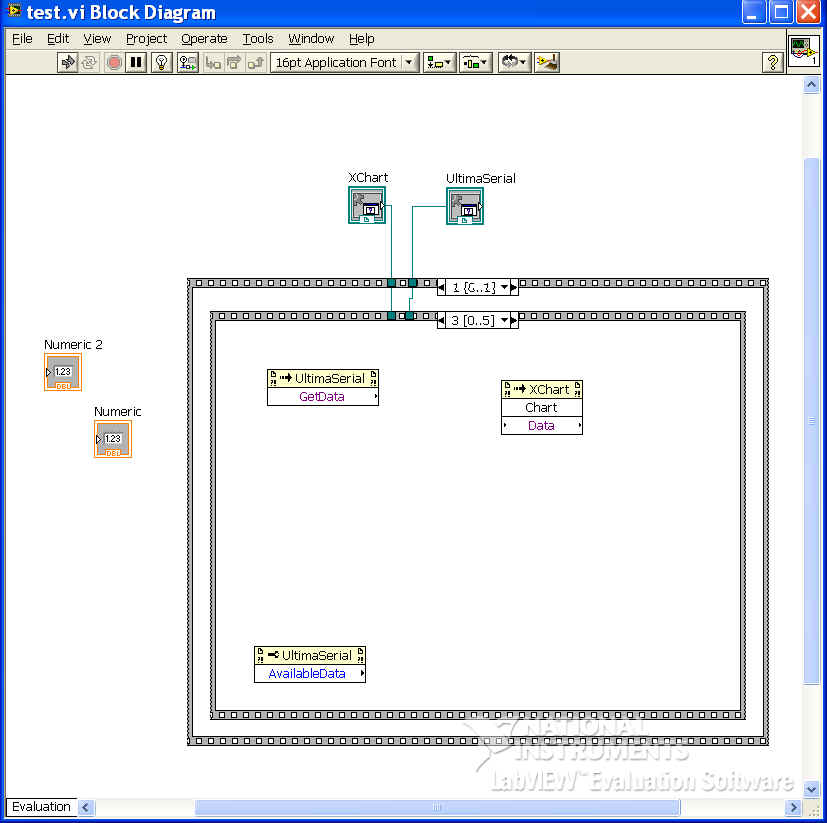
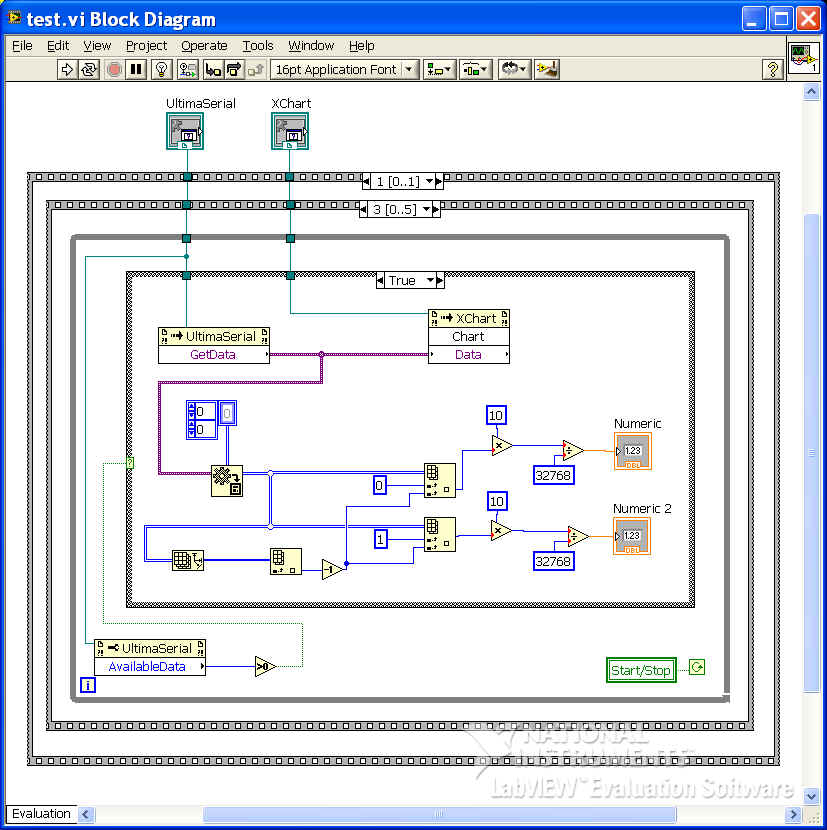
- In Frame 3 of the same sequence, follow the above procedure to bring in
Ultmaserial.GetData, Ultimaserial.AvailableData and
XChart.Chart
- Added
the followings
 Multiply from
RightClick->DoubleDownArrow->Mathematics->Numeric->Multiply
Multiply from
RightClick->DoubleDownArrow->Mathematics->Numeric->Multiply Division from RightClick->DoubleDownArrow->Mathematics->Numeric->Divide
 Decrement from RightClick->DoubleDownArrow->Mathematics->Numeric->Decrement
 Array Index from RightClick->DoubleDownArrow->Programming->Array->Index
Array. You can resize it to show more input nodes
Array Index from RightClick->DoubleDownArrow->Programming->Array->Index
Array. You can resize it to show more input nodes Array Size
from RightClick->DoubleDownArrow->Programming->Array->Array
Size
Array Size
from RightClick->DoubleDownArrow->Programming->Array->Array
Size Variant to Data from
RightClick->DoubleDownArrow->Connectivity->ActiveX->Variant
to...,
Variant to Data from
RightClick->DoubleDownArrow->Connectivity->ActiveX->Variant
to...,  While loop from RightClick->DoubleDownArrow->Programming->Structure->While
Loop
While loop from RightClick->DoubleDownArrow->Programming->Structure->While
Loop
- Click on the red circle to change the condition to
- Click on the red circle to change the condition to
 Case Structure
from RightClick->DoubleDownArrow->Programming->Structure->Case
Struct...,
Case Structure
from RightClick->DoubleDownArrow->Programming->Structure->Case
Struct...,  Array Constant from RightClick->DoubleDownArrow->Programming->Array->Array
Const...
Array Constant from RightClick->DoubleDownArrow->Programming->Array->Array
Const...
- Resize it to two dimensional

- Create a constant zero as I16 and uncheck Adapt to entered data

- Add this constant to Array Constant's data basket

- Resize it to two dimensional
 Great than zero from RightClick->DoubleDownArrow->Programming->Comparison->Greater
than...
Great than zero from RightClick->DoubleDownArrow->Programming->Comparison->Greater
than...- Several numeric constants
 ,
,  ,
and
,
and
- Wiring
-
connects to the data type of Variant to Data
- connects
to the condition of case
- The output of Ultimaserial.GetData connects to the input of
XChart.Chart.Data and the input of Variant to Data
- The output of Variant to Data
connects to the input of Array Size
and Array Index
- The others should be trivial.
-
- This is what you should get:
- Frame 4

- Frame 5. RightClick->DoubeArrowDown->Connectivity->ActiveX->Close
Ref. Connect the Close Ref to Ultimaserial
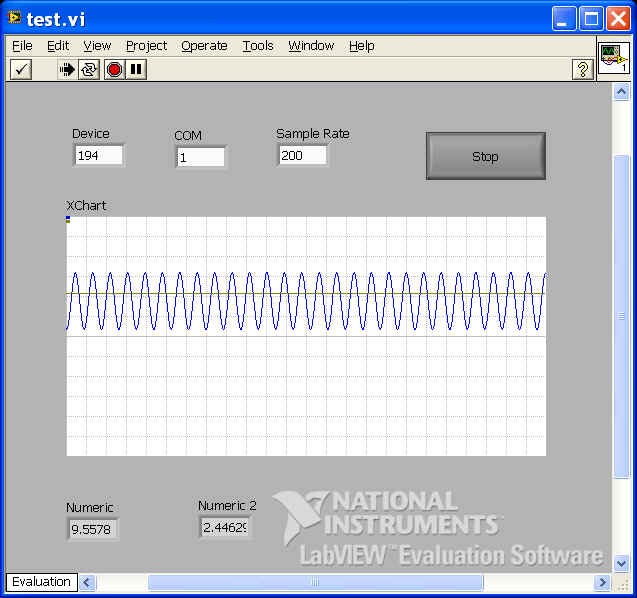
- Switch back to Front Panel window, and Run it
- Enter device name, COM port and sample rate
- Click on Start button, and here is the result
- If you wish to plot the waveform to the Waveform Chart from Labview, read on
- Stop the program and switch back the Front Panel view
- Resize the Panel so that we have room to add LabView's Waveform Chart to it
- Right click on the grid, follow Graph Indicators->Chart, and place a chart on the Front Panel
- Right click on the Waveform Chart and select properties
- Select 2 for "Plots shown"
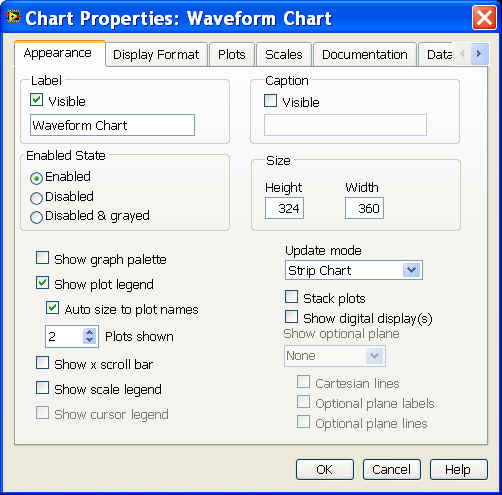
- Now the Front Panel is like this
- Switch to Block DIagram view of the project and wire the input of Waveform
Chart to the output of Variant To Data, like this

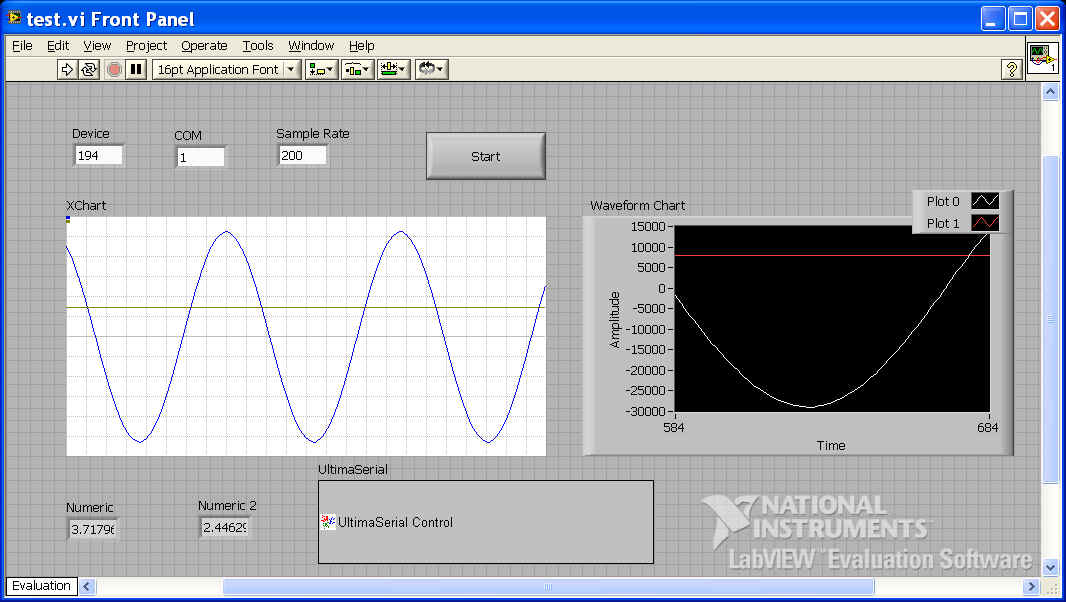
- Switch back to Front Panel View, right click on Waveform Chart and uncheck "Transpose Array"
- Run it, and here is what you will see
Last update: 03/14/22
Copyright: 2000-2005 www.UltimaSerial.com